Passive Software
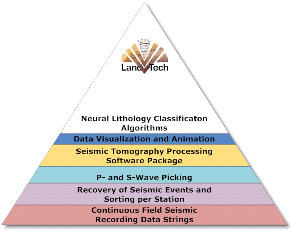
A high resolution Passive Seismic Tomography Survey (PST) requires the processing of vast amounts of noisy data. The algorithms have to recover from many thousands of hours of 3-component continuous recordings, (in all the stations of the passive network), those (useful) parts that correspond to the local microseismicity and isolate the corresponding seismograms which sometimes are invisible. LandTech has spent a lot of effort to develop advanced state of the art software to process PST data putting emphasis on resolution and quality control. The main categories of LandTech's PST processing software are:
In Passive Seismic Tomography (PST) investigations the accuracy of the arrival time picking of P- and S- waves is essential for the final result. Although there are many automatic picking algorithms mainly used by seismological institutes these are not convenient for a high resolution PST survey due to the fact that we are interested in very small magnitude microearthquakes (sometimes negative magnitudes) which are embedded in noise.
LandTech's P- and S- wave arrival time detection algorithms are based on Higher Order Statistics (HOS) based methods, skewness, kurtosis and differential entropy (also known as negentropy) and not on the simple STA/LTA (Short/Long Term Averages) methodologies used in classical seismology. Furthermore advanced Winner and Kalman filtering data conditioning stages and neural networks are used during the various processing stages.
Some basic software modules which LandTech has designed to process PST data are the following:
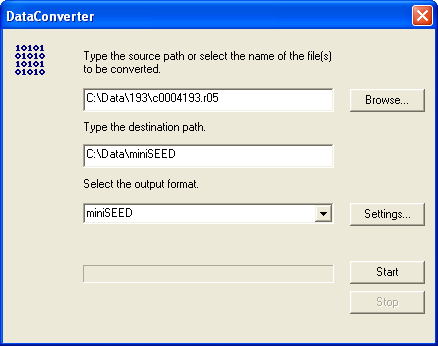
LT DATA CONVERTER
DataConverter makes it possible to quickly and easily convert CORE24 files to ASCII or MiniSEED, or other format. We can use DataConverter to convert a single file, a group of files or all files in a directory.
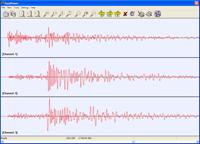
LT DATAVIEWER
DataViewer allows you to work with files that were created in LandTech’s SR24 recorder. Using the DataViewer, you can zoom in and out of the graph, find specific features, select features that meet certain criteria, display information about them, and many more.
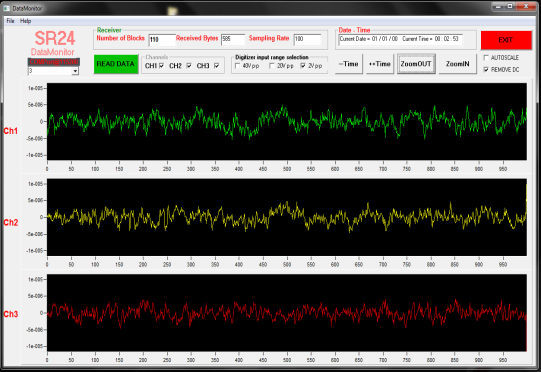
LT DATAMONITOR
- Plots the real time data string from our digitizer / recorders
- Displays timing information and sampling rate
- Auto-scale, manual scale, zoom in/out, variable window length

LT HELICORDER
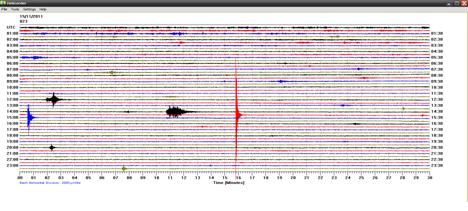
The Helicorder open window shows a record of how the ground moved at a particular seismographic station, during a 24-hour period. The graph is “read” like a book, from left to right and top to bottom. The colours of the horizontal lines have no particular significance and are used to facilitate the graph reading.
- Plots the waveform of the CORE24 data directories (24h)
- Tools for plot, end editing with DataViewer
- Gives clear picture of a 24h record
LT SEISMWIN ®
SEISMWIN is a package designed for automatically organizing the recorded data on LandTech's sensors, use special winner filters to improve S/N ratios and determine the arrival times of P- and S-wave phases. Also is used for first pulse width and amplitude measurements and calculates moment tensors.
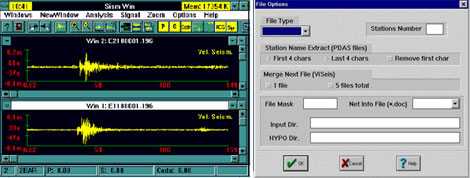
In cases that we encounter very noisy data SEISMWIN has certain S/N improving modules such as Kalman and Winer filters, or the specially designed LANSEIS passive seismic retrieval algorithm (see below).
LT LANSEIS ®
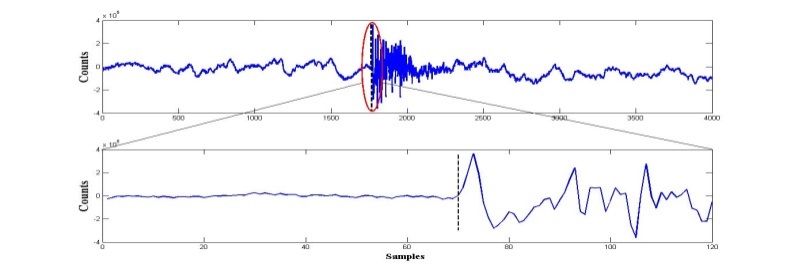
LANSEIS is a specially designed algorithm which uses special filtering based mainly on S-transforms and rotates the recorded seismograms optimally in order to improve the S/N ratio of the arrival of P- and S-waves.
Because of the frequency dependency of seismic noise and the nonstationarity of the recorded signal, tools that can effectively take into account the frequency-time variation of the seismic recordings are more suitable for fulfilling this task. The S transform is an invertible time-frequency spectral localization technique that combines elements of wavelet transforms and short-time Fourier transforms.
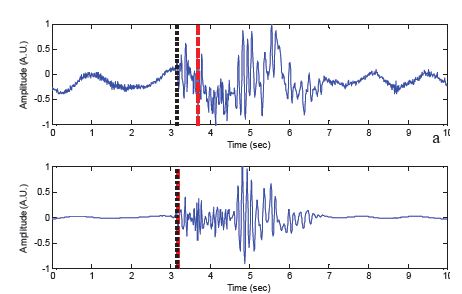
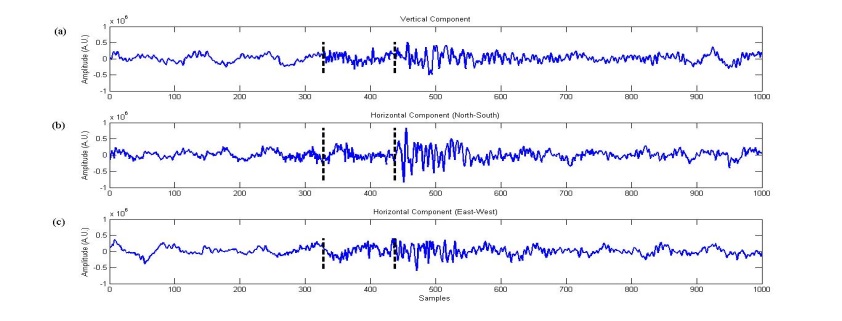
The red dashed line is the automatic pick as calculated using the kurtosis criterion (on the filtered by the S-transform de=noised seismogram) and the black dotted line is the actual position of the first break arrival.
In LANSEIS, a customized thresholding technique is applied to the S-transform coefficients for obtaining an optimally (in the sense of the maximum increase of the signal-to-noise ratio with a minimal loss of information) denoised seismogram.
Click here to download a paper describing event detection and noise reduction methodology developed by LandTech.
LT PATOS ®
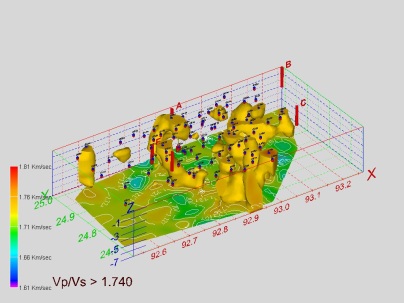
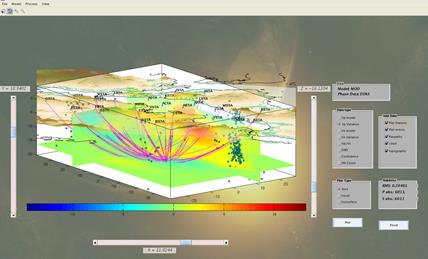
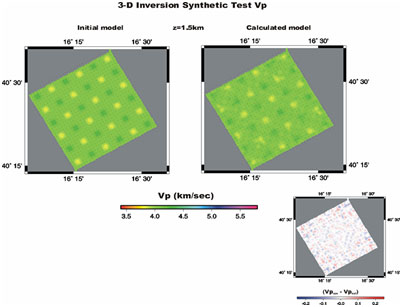
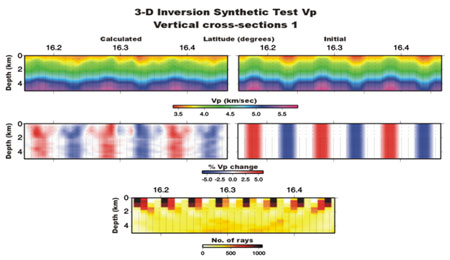
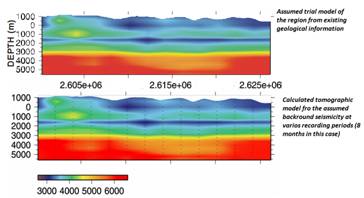
PATOS is an integrated passive seismic tomography package for inverting P- and S-wave travel times for 3-D velocity and Poisson’s structure and microearthquake locations. It uses an algorithm based on adaptive grid.
PAT© A the latest development of landetch engineers on passive seismic tomographic inversion
The most critical part of any Passive Seismic Tomography (PST) survey is the algorithm that is used to invert the arrival times of the P- and S- seismic phases to reliable geological models. LandTech engineers have recently developed a new revolutionary inversion algorithm (PAT) that incorporates new ray tracers, the required for the 3D inversion initial model using seismic interferometry, seismic array processing and an expert system mechanism which increases the resolution by an order of magnitude.
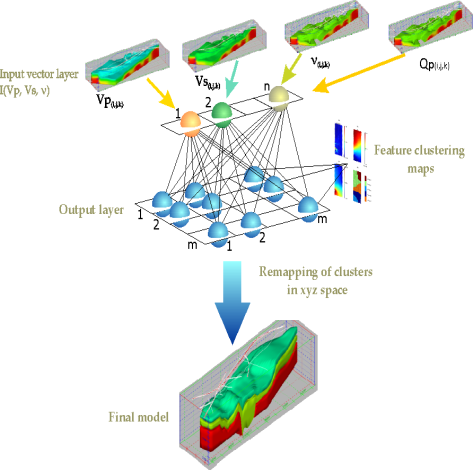
LT PASOM ®
PASOM is a Kohonen neural network based algorithm which has as inputs 3D volumes of Velocity, Poisson, quality factor and provides information about lithology.
Click here to download brochure
LT QPAS ®
QPAS is an algorithm specifically designed for the quality control of the results of the passive seismic survey. It emphasises on resolution at various sections of the data set and uses various checker board tests and inversion data accuracy parameters.
Click here for LandTech's Quality Control Methodology
LT PASEID ®
PASEID is a software for feasibility tests and designing passive seismic surveys (i.e. number of stations, station spacing, recording time) taking into consideration local geology, noise level and required resolution.

The Event Detection Software
- Extracts micro-events recorded in a micro-seismic network
- Composed of separate components that can be connected together (Modular Architecture): Parser, BandPass Filter, Picker, Classifier, Associator, Post Processor
- The user can replace or add any one component without affecting the rest of the system. Therefore, it can support many processing algorithms
- Takes into account seismic network topology
- Can be applied to data recorded by a group of station
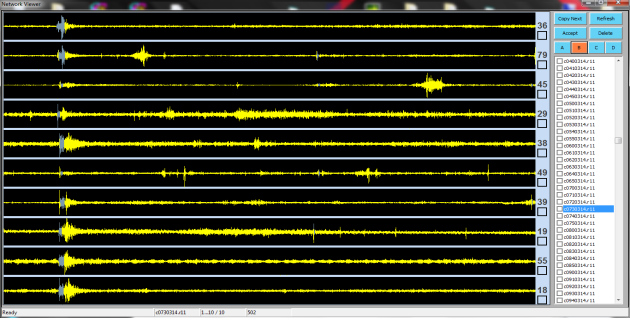
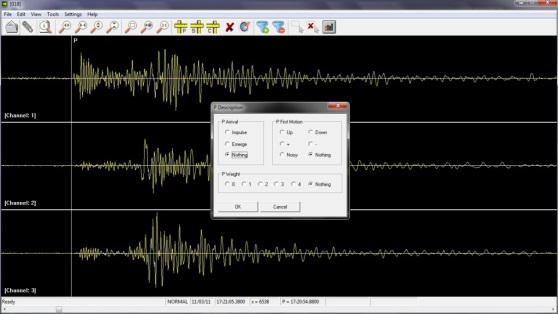
The Event Detection post processing screen
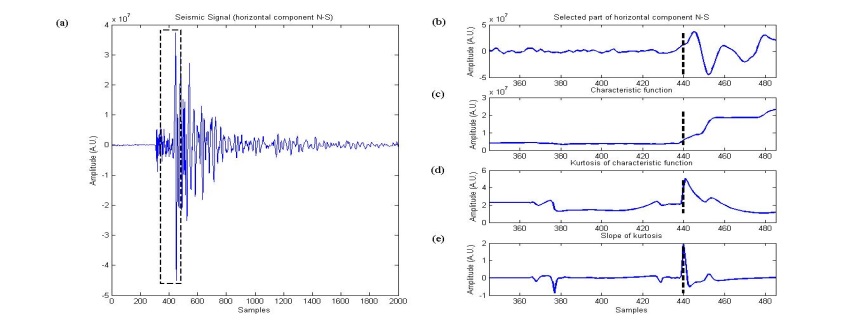
Automatic P-onset time estimation algorithm
Based on parameters derived by Higher Order Statistics, such as skewness, kurtosis and negentropy (linear combination of skewness and kurtosis.)
The above mentioned parameters are evaluated by means of a sliding window.
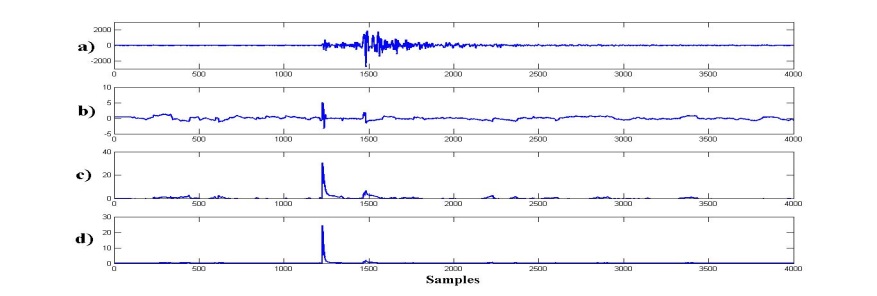
HOS parameters’ estimation demands low computational resources. It present smaxima in the neighborhood of the P-arrival due to the change of the signal statistics. The maximum slope of HOS’ curves corresponds to the estimated P-arrival time.
Automatic S-onset time estimation algorithm
Eigenvalue analysis is taking place in small time intervals and the corresponding eigenvalues are obtained for each step. The sequence formed by the maximum eigenvalues, provides a characteristic function.
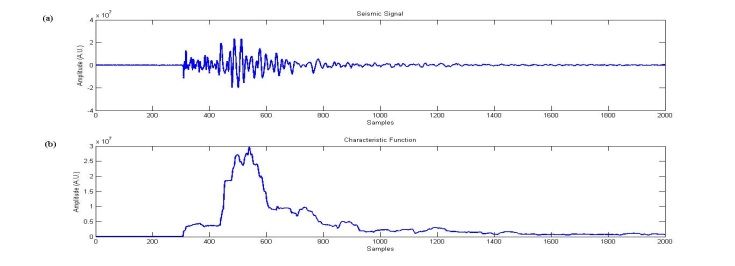
The Kurtosis criterion is applied on a specific part of the characteristic function. A first S-wave arrival estimation is given by the maximum slope of the new curve, which is formed by the kurtosis of the characteristic function.
In order to reduce the algorithm’s dependence to the moving window’s length, a multi-window approach is followed, combined with an energy –based weighting scheme. From the above procedure, a weighted S-onset is provided, which is the final S-arrival estimation.
The SeismPlus
Waveform display - Arrival time picking – Hypocenter location calculation. Process CORE24 files and several other data formats. Supports tools for filtering, FFT, integration/differentiation, convolution/deconvolution, response, spectra etc.
The Firmware Update Software
Ability for ON-SITE Firmware Upgrade of our instruments
