Geothermal Exploration
LandTech was the first company to apply passive seismic services to the hydrocarbon, geothermal and reservoir monitoring industries since its establishment in 1998 and has become the leader in High Resolution 3-D Passive Seismic Tomography (PST) surveys worldwide. LandTech-Geophysics has created a special division for Geothermal reservoir monitoring and has developed all the required for this kind of projects instrumentation.
LandTech-Geophysics provides the following Geothermal services:
| A) |
EXPLORATION STAGE |
|
- Exploration for the detection of new reservoir
- Delineation of known Geothermal systems
|
| B) |
PRODUCTION STAGE |
|
- Monitoring of producing zones and 3D delineation of their boundaries
|
| C) |
DEVELOPMENT STAGE |
|
- Monitoring of fracking activities, pinpoint sites for new boreholes
- Early warning during fracking if certain conditions are reached
|
| D) |
PERMANENT MONITORING |
|
- Installation of permanent seismological networks around the field, real time data processing and parameter visualization, transmission via GSM, Radio Link or Satellite telemetry to the client’s office
|
How Passive Seismic Tomography can provide vital information about a Geothermal reservoir
Geothermal and unconventional hydrocarbon reservoirs are often characterized by low permeability and porosity. So, they are difficult to produce and require stimulation techniques, such as thermal shear deactivation and hydraulic fracturing. Fractures provide porosity for fluid storage and permeability for fluid movement and play an important role in production from this kind of reservoirs. Hence, characterization of fractures has become a vitally important consideration in every aspect of Geothermal exploration, development and production so as to provide additional energy resources for the world.
Seismically active geothermal areas are well-suited to local-earthquake tomography because earthquakes are often well-distributed throughout the reservoir and production zone. LandTech-Geophysics has studied several geothermal fields, including both unexploited and heavily exploited reservoirs, using Vp, Vs and Vp/Vs tomography.
Experience has shown that Vp/Vs is particularly useful in imaging exploited fluid zones. A low Vp/Vs ratio is thought to be caused by abundance of fractures filled with hot water. In fact, the mechanism of water steam transition has a stronger effect on compressibility than shear modulus, leading to low Vp/Vs ratios.
The relationship between low Vp/Vs ratios and geothermal areas is so sound that the study of the Vp/Vs ratio is a promising technique to identify geothermal resources and monitor their exploitation. Contrarily, melt inclusions reduce S-wave velocity more than P-wave velocity, resulting in high Vp/Vs ratios. Also, progressive depletion of reservoirs can be monitored by tomography repeated every few months. Also, accurate microearthquake locations can potentially delineate faults that represent valuable zones of permeability and desirable targets for new production wells.
During the injection or production of fluid, induced seismicity (micro-seismic events) can be caused by reactivated shears created fractures or the natural fractures in shear zones and faults. Monitoring these events can help visualize fracture growth during injection stimulation.
Tomographic inversion, fuzzy clustering, and shear wave splitting are three methods that LandTech-Geophysics apply to microseismic data to obtain reliable characteristics about fractured areas. These techniques can be integrated with each other or with other data for a more holistic approach. The knowledge gained might be used to optimize drilling targets or stimulation jobs to reduce costs and maximize production.
In Geothermal reservoir, microseismic monitoring and the PST is a proven technology for characterizing fracture network created from fluid injection and hydraulic fracturing and also production optimization of Geothermal reservoir. LandTech’s engineers are using the spatial/temporal progression of microseismic activity and the corresponding tomographic 3D volumes, in order to interpret the fracture height, length, azimuth, zonal coverage, and fracture complexity in terms of a simple, planar fracture, or a complex fracture network. They have also correlated production data with the dimensions of the microseismic clouds and volume estimates based on the density of microseismic events and the tomography results.
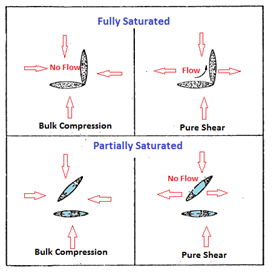
In addition to determination of velocity and Vp/Vs volumes LandTech has developed the technology to obtain 3D volumes of seismic attenuation (or alternatively the Qp quality factor). Increasing pressure closes pores and decreases attenuation. Seismic attenuation is again very low in dry rocks whereas in partially saturated rocks (Sw = 95%) attenuation is significant probably due to intracrack fluid flow, with P attenuation about twice as large as S. In fully saturated rock, intercrack flow is eliminated, Qp is sharply lowered and again shear attenuation due to intercrack fluid flow is maximized.
In fully saturated rocks first order intercrack flow may occur only in shear, not in compression. Since the P wave is strongly affected by bulk compression it is less attenuated than an S wave. In partially saturated rock flow will occur within all pores, induced by bulk compression; whereas shear induces flow only in properly oriented pores. Consequently S attenuation is less than P. In rocks containing no liquid phase, no flow occurs and attenuation is low for all waves. Hence, the ratio of P to S attenuation may allow us to distinguish between a partially saturated and dry or fully saturated rocks.
We can also measure the arrival times of S-waves, as well as other parameters too, that determine the attenuation of the medium (i.e. seismic amplitudes or first seismic pulse widths). LandTech-Geophysics has developed special algorithms to automatically detect the P- and S-wave arriving phases.
Although the high resolution velocity models have inherent uncertainty within them, they can be a powerful tool in characterizing the Geothermal reservoirs. Effective, reliable, and accurate characterization of the geothermal reservoirs, espe-cially their complex fracture system necessitate fundamental understanding of the geophysical and geomechanical properties of the reservoir rocks and fracture systems. Geophysical and geomechanical anomalies in the reservoirs can be ascribed to various features of the reservoir such as porosity, fracture density, salinity, saturation, tectonic stress fluid pressures, and lithology.
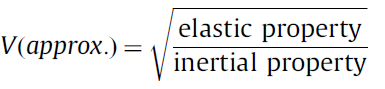
Having both compressional and shear wave velocity models, it is possible to define most of the elastic rock properties of sedimentary rocks uniquely. These velocities are approximately related to the square root of its elastic properties and inversely related to its inertial properties:
for instance in rock materials, VP and VS are defined by the following equations:
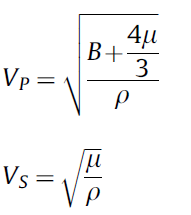
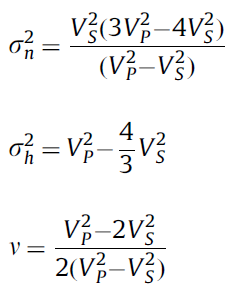
where ρ is density(an inertial property), B is bulk modulus and m is shear modulus. Normal stress (sn), hydrostatic stress(sh), and Poisson’s ratio can also be described in terms of these seismic velocities:
After calculating the necessary property volumes, we need to define a framework to relate these geophysical and geomechanical properties to fractured reservoir properties. Many factors affect these velocities in all scales such as porosity, fractures, pore pressure, and saturation. In summary, closing of small cracks due to pressure with depth, increase in overburden pressure, and cementation are some causes of increase in seismic velocity. Fracturing, chemical alteration, extreme temperature gradient with depth, pore pressure, and porosity are main causes for reduction in velocities.
Fluid saturation has different effects but overall, has little effect on VP, reduces VS and enhances VP/VS with a higher degree of impact on VP/VS and Poisson’s ratio. For a highly fractured region, we expect low VP and VS while high VP and VS may indicate un fractured regions.

Fig. (a) illustrates the behavior of a fracture under a two-dimensional stress condition. Three types of stresses typically act on the fracture surface which is defined as: normal stress (sn), shear stress, and static frictional stress. Each of these states of stress can cause the associated fracture modes as shown in Fig. (b). Fig. (a) also shows the state before pore pressure (p) increase caused by pressurized injection from stimulation in hydraulic fracturing or the initial contact of water with new planes of weakness. Fluid injection reduces the effective normal stress and raises the porepressure which depreciates the peak stress that the interface can support. Hence, at some level of pore pressure increase, shear slip may occur once the peak frictional stress becomes smaller than the shear stress. In addition, reduced effective stress may also cause fracture dilation. In another scenario, cold fluids interacting with hot rock can cause contraction of fracture surfaces.
Reduction of effective stress causes the slight opening of the fracture, reduces static friction and triggers slip along planes of weakness in the thermal contraction process. In both scenarios, we can use the effective normal stress as an index for fracture opening which is essential for fluid movement and production. We can also use the hydrostatic stress as an indicator of pore pressure and fractured areas. Shear slippage along pre-existing fractures or flaws caused by pore pressure increase can create fluid flow pathways for production. They hypothesized that since the shear failure fractures have the associated condition where Coulomb failure is reached for smallest pore pressure increase, this type of fractures mainly contribute toward fluid production and the distribution of these favorably oriented pre-existing fractures and their interaction with the regional stress field strongly controls the growth direction of the reservoir. Therefore, both hydrostatic stress and normal stress distribution can be used to identify and delineate the fractured areas from un fractured ones.
In general the application of a PST survey in a geothermal region can lead to the following results:
- Tomography from wave propagation can image reservoir for seismic velocity and attenuation, geologic structure, and lithology
- Accurate plotting of microseisms can delineate fracture zones
- Interpretation of tomography results (rock physics) can identify altered or permeable zones, phase states of fluids, crack density, and saturation
- Improve resolution for drilling targets
- Improve success estimates for drilling targets – Monte Carlo Coupled inversion
- Monitor existing wells and production
- Variations in lithology observed in elastic constants
- Increase of velocity and decrease in attenuation with depth due to closing of small cracks because of pressure
- Decrease in velocity and increase in attenuation due to fracturing
- Decrease in velocity due to chemical alteration
- Extreme temperature gradient works to decrease velocity with depth
- Fluid saturation acts to stiffen the pores to deformation; affects P-waves, but not shear-waves
- Saturation increases the density of the material and increases both compressional- and shear-wave velocity, and increases attenuation
- Dilatency can cause expansion and permeability
EXAMPLES OF HOW PST CAN BE APPLIED TO GEOTHERMAL FIELDS
Example 1: Geyser production Geothermal field
Due to the very low permeability of the formation matrix the production depends on the presence of natural or induced fractures. A great number of microseismicity is generated during the operation of this Geothermal field as it can be seen in the following figure (Modified from the work of: Aminzadeh et al., An integrated methodology for sub-surface fracture characterization using microseismic data, A case study at the NW Geysers )
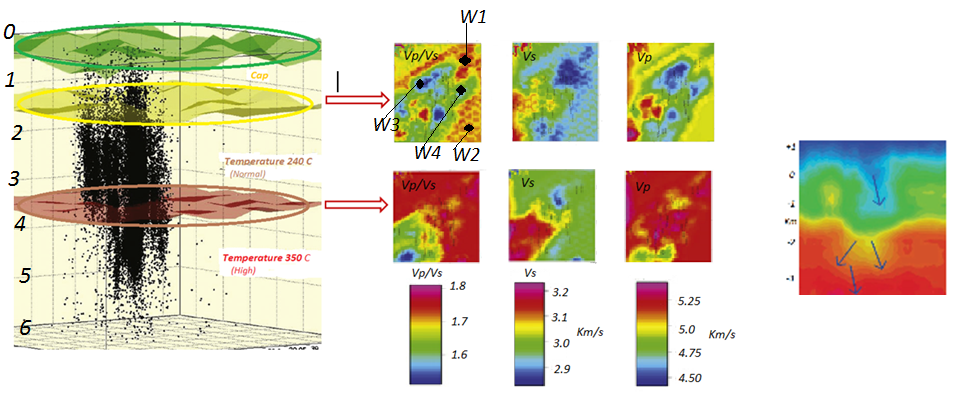
We can observe two different horizons in this Geothermal field. The first horizon is located in the normal temperature reservoir where the injection and production wells have been completed. The existing fracture network within this zone, has main role in production of steam. Our aim in this horizon is locating and characterizing the fracture network. The second horizon is the area 1500 ft below the depth of deepest wells and within the high temperature zone where there is little or no production. Our goal here is identifying zones where the fracture network propagates in order to create an enhanced geothermal system. We present horizontal sections of VP, VS, and VP/VS on these two horizons. High VP/VS anomalies associated with low VS anomalies may be saturation anomalies. On the other hand, high VP/VS anomalies associated with high VP are caused by other phenomena such as lithology effects. Finally, it is reasonable to assume that low VP/VS anomalies associated with low VP anomalies are fracture related anomalies.
Based on the identified framework, we can identify highly fractured zones of interest by interpreting the observed velocity anomalies. As per our discussion, we interpret the area below and around the W3 well to have the highest fracture density. In contrast, the area below and around W2 and W1 is interpreted to have the lowest fracture density within this horizon. Moreover, we can successfully locate the propagated fracture network in the high temperature zone below the W3 and W4 wells. Reduction in normal stress indicates the areas where fractures are open to provide sufficient permeability along with low velocity anomalies and this acts as a further validation that the identified anomalies are fracture related and not from lithology or other phenomena.
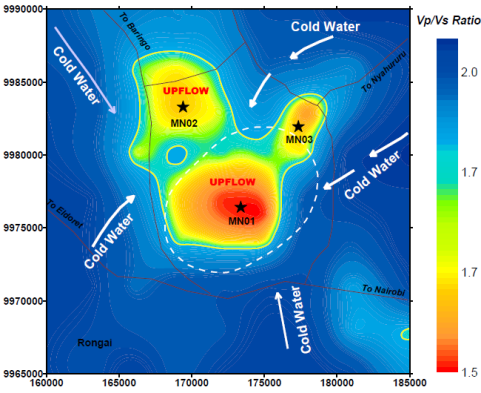
Example 2: Application of PST methodology in a Geothermal field in Kenya
In the figure below, we present another example on how a PST survey revealed clearly the mechanisms controlling a geothermal field in Kenya. We observe a strong Vp/Vs anomaly that corresponds to the most highly intruded part of the field. This anomaly indicates low pressure and dry conditions caused by boiling of pore water due to limited fluid inflow. The low values correspond to a decrease in P-wave velocity due to high heat flow, fracturing of rocks and steam saturation. The geothermal reservoir area that is based on the 1.71 Vp/Vs ratio is about 80Km2 and the main productive zone would be in the depth range of 1200-2500m. Based on these, three possible drilling sites (stars) are proposed.