PST Case Histories
CASE 1 Regional Investigation of a 60x40Km2 block (Click here to see the brochure)
Client Enterprise Oil / SHELL
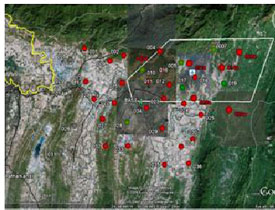
The block is located within a thrust belt zone in NW Greece and conventional seismic failed to provide any information due to bad seismic energy penetration problems. The upper layers consisted of Karstified weathered limestone. The region is mountainous.
Scope of the survey was to:
- Map the evaporites
- Obtain an accurate velocity model to reprocess the 2D seismic sections
- Obtain a 3D geological model
- Locate possible targets of hydrocarbon potential
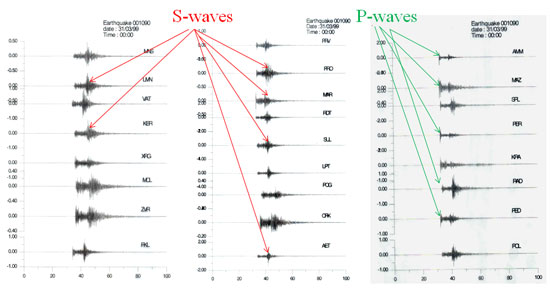
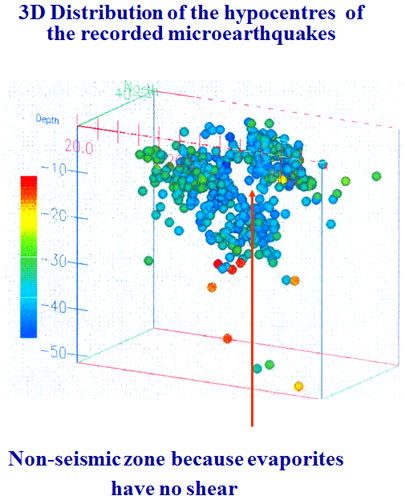
In the illustation below we present the waveforms of a microearthquake recorded at 26 stations of the installed network. Note the arrivals of P and S waves.
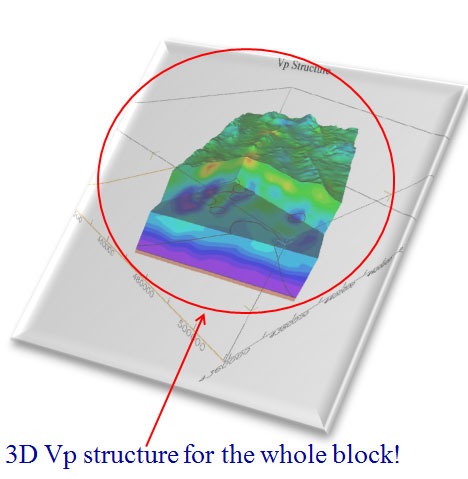
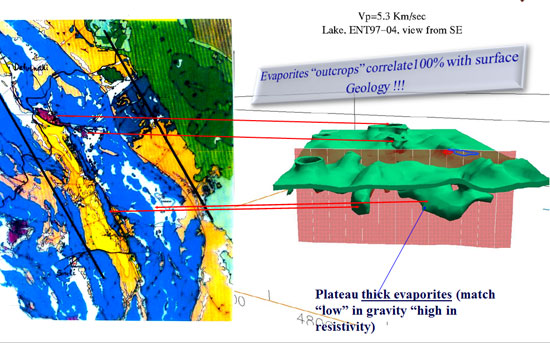
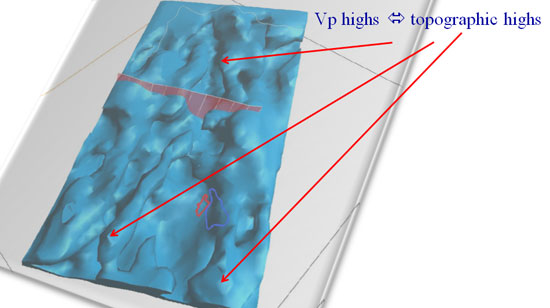
After obtaining the 3D Vp, and Poisson’s structure of the whole of the block, and setting specific velocity and Poisson’s value limits we can isolate and map in 3D particular formations. Below we present an example of evaporites mapping.
Knowing that the limestones in the region have Vp values>5.6Km/s and isolating from the 3D velocity volume all formations with Vp values greater than 5.6 we were able to map the basement bedrock as it is depicted in the figure below.
The obtained PST data were also in agreement with gravity data

The obtained PST data can also be presented in the form of 3D animated videos.
CASE 2 Improvement of existing seismic sections by reprocessing using a 3D velocity model obtained from passive Seismic Tomography (Click here to see the brochure)
Client Enterprise Oil
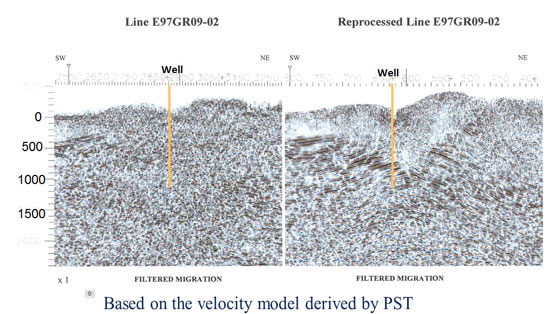
The region encountered severe seismic penetration problems due to heavily weathered surface limestone layers, high topographic reliefs and evaporite barriers. The conventional seismic 2D seismic lines were of very bad quality due to inaccurate velocity models used for the data processing. After reprocessing the conventional seismic data using the 3D velocities obtained from the PST survey (Post stack depth migration) the obtained results showed an astonishing better resolution as it is depicted in the figure below.
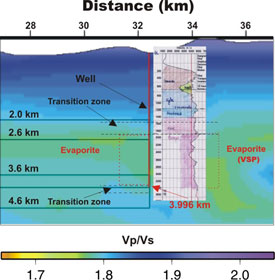
CASE 3 Comparison of Passive Seismic Tomography results with VSP data!
If the design of a passive seismic network is appropriate and certain processing stages are followed, the obtained results can even be compared with the results of a VSP survey!
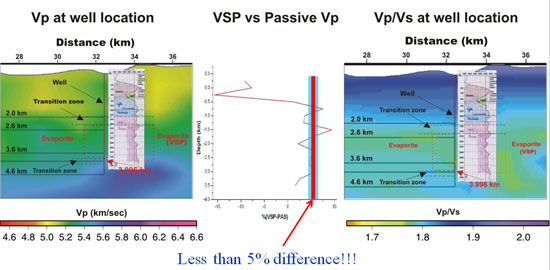
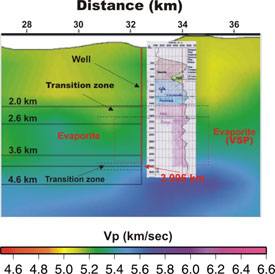
In the figure below we show the comparison of the obtained PST Vp and Vp/Vs data with the lithology obtained from the well.
CASE 4 Passive Seismic Tomography survey over an oil and gas producing block in Albania (Click here to see the brochure)
Client: Stream Oil-Canada
The scope of the survey was to delineate the producing reservoir and obtain a 3D model of the area indicating position of future wells.
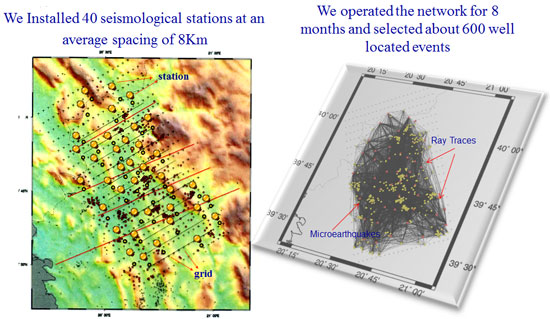
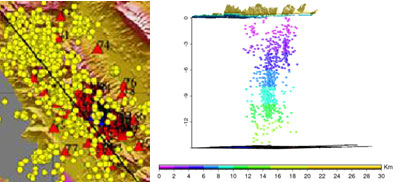
40 LandTech's passive stations were installed and operated for a few months all over the block and the recorded microearthquakes were used to provide all the required information to the client.
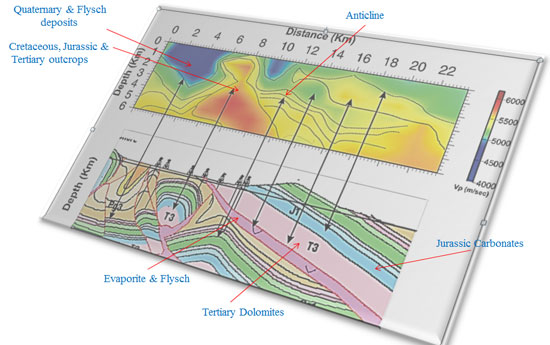
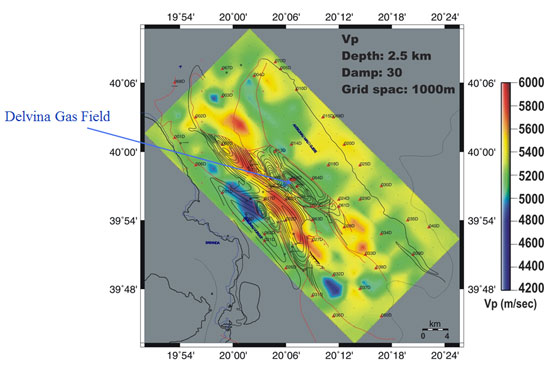
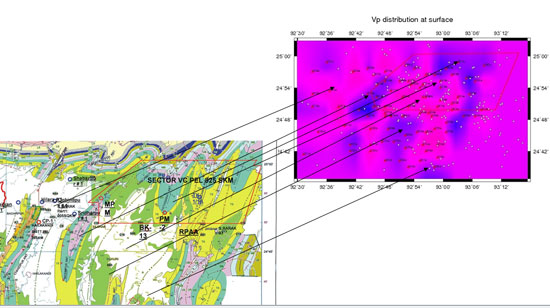
In the figure below we depict the general correlation of the obtained PST data with the prevailing geology and tectonics in the region. The agreement is excellent.
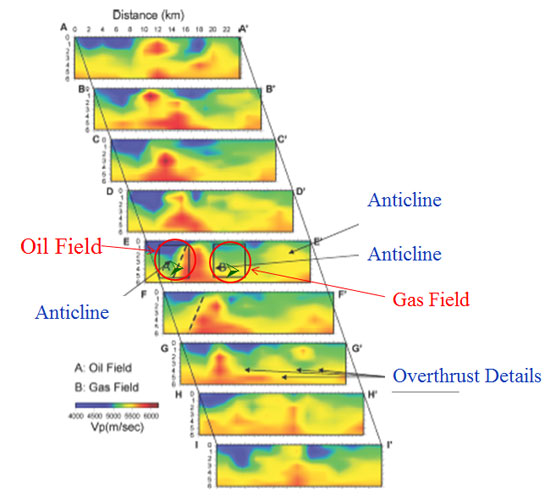
The figure below presents some PST vertical cros ssections along the exploration block. The locations of the oil and gas fields are also presented.
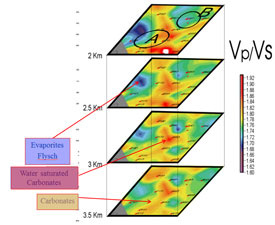
A Vp/Vs vertical crossection obtained from the PST survey is depicted in the figure below

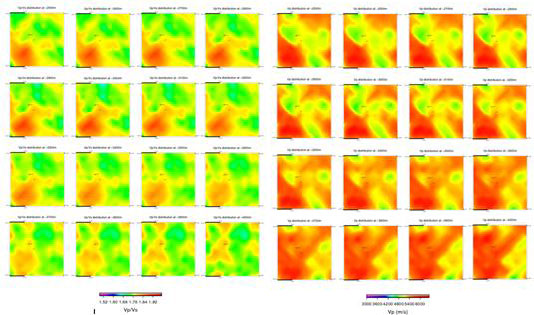
Horizontal Vp and Vp/Vs cross sections obtain from the PST survey at a spacing of 500m are presented in the following figure.

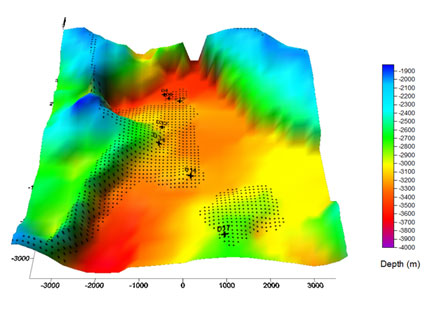
The correlation of PST Vp results (@3.5Km) with isodepths of wells are shown below
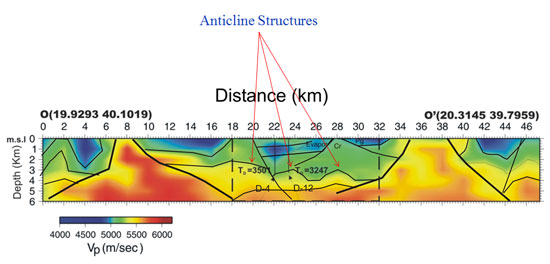
An example of an interpreted 2D section of PST Vp results is presented in the following figure
CASE 5 Proposing the location of a producing well in a region of low production wells.
Client National hydrocarbon organization of Albania
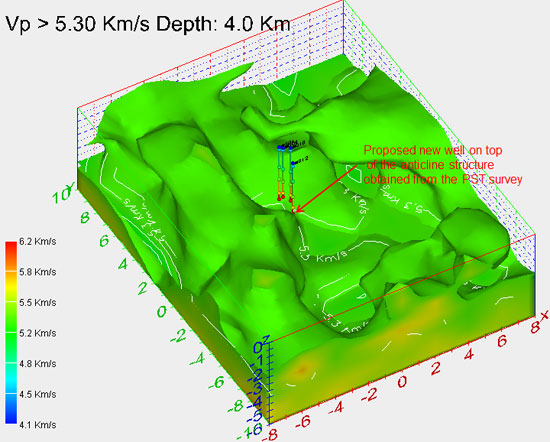
Within a gas producing oil field in Albania the client wanted to explain the low production rate of some wells and drill a new well with a higher production rate. After performing a high resolution PST survey of the region it appeared that the low production wells were in the vicinity of the anticline structure (see figure below were we plot all the formations with Vp>5.3 from 4Km upward). We proposed the position of the new well to be on top of the anticline and the obtained production rates were satisfactory.
CASE 6 Bedrock mapping for an engineering geophysics project
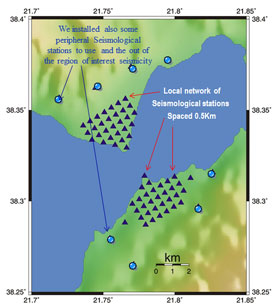
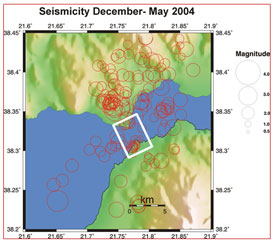
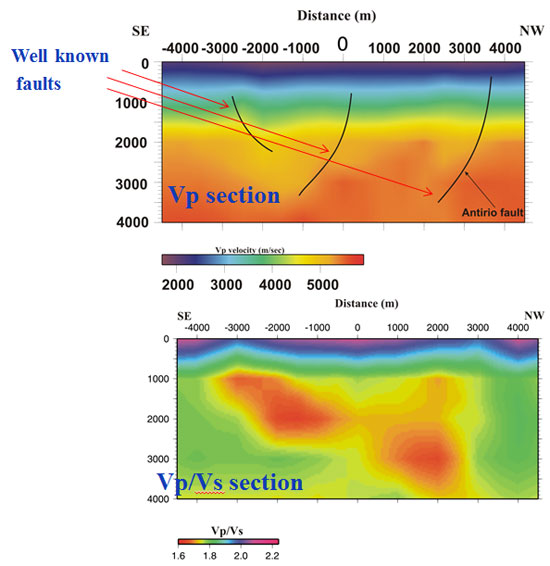
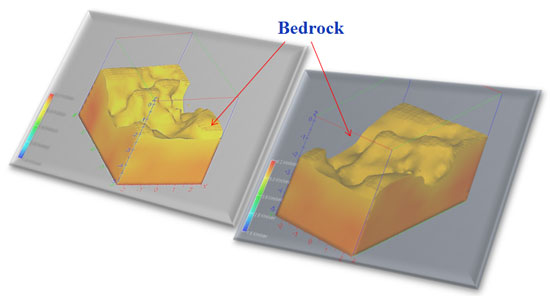
LandTech’s PST methodology can be used even for local scale engineering geophysics projects. In this case we decrease the grid spacing of the installed sensors in order to increase the seismic ray coverage. Below we present a case where the problem was to locate the bedrock basement and possible faults in the construction site of a 3.5Km cable suspended bridge.
CASE 7 Results of a Preliminary Test Investigation on the Applicability of PST in VC Block-Assam, India
The purpose of this investigation was to undertake a 1st Phase passive (blind test) seismic survey in Assam area in order to examine if the natural seismicity in the area is sufficient enough to provide a 3D Vp and Vp/Vs subsurface model via passive tomography (PST) and provide a course velocity and Vp/Vs model after 3 months of recording. The designed network spanned an area of 1900km2
The obtained Vp/Vs values < 1.7 for the entire block are presented in the figure below
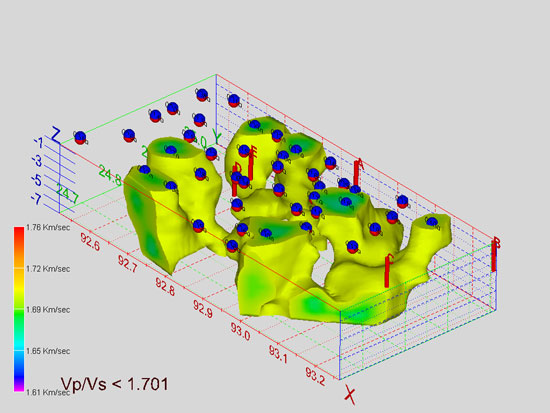
Even though the network was operating for only 3 months the correlation of the PST data with the prevailing geological structures of the region was astonishing.
Many other case histories can be shown to the potential clients upon request.
CASE 8 Problem: Reducing drilling risk for gas production using passive seismic tomography
A 75 stations passive seismic network was installed in the area and operated for 10 months. The region was encountering severe seismic penetration problems and conventional seismic failed to provide any useful information. In order to spot the existence of zones of interest, in terms of hydrocarbon (gas) exploration, all available information on the study area (existing geological and geophysical information, along with well data from two local unsuccessful wells) was examined thoroughly, leading to the following remarks:
- From local geology, the formations of interest are sandstones (locally met at an approximate depth of 2km and4km, in the case when the clays act as a cap rock. These formations have the potential of containing hydrocarbons, if the local structural characteristics favor the existence of hydrocarbon traps.
- Calibration of PST data with local geology (well data) has shown that the formations of interest are characterized by a seismic wave velocity ranging between 4.5 and 4.8km/s.
- The Vp/Vs value is directly correlated to the fluid content of formations, thus giving a strong indication on the existence of zones of interest. In the case of tight sands, the Vp/Vs variations follow the following pattern:
- As porosity of the formation increases, the value of Vp/Vs decreases.
- Gas saturation results in a significant decrease of the Vp/Vs value, while water saturation increases Vp/Vs.
- Although the Vp/Vs value of gas saturated sandstones is generally lower than 1.60, in the case of less consolidated formations the expected value may be increased.
- The existence of clay or shale in the sandstone causes a small increase in the Vp/Vs values. As a result, shales are characterized by higher Vp/Vs.
Delineating areas of interest in the passive seismic tomography model is performed by cross-examining Vp and Vp/Vs distribution (figure below), searching for areas that meet specific criteria.
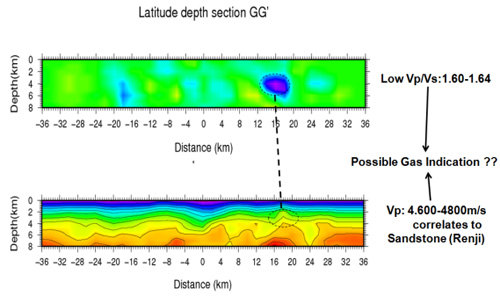
Detection of a possible gas indication by cross-examining Vp and Vp/Vs sections.
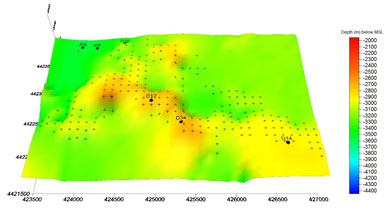
In the following figure (figure 8), the visualization of the upper part (top surface) of the volume of interest of each one of the three areas is presented. The x and y axes correspond to longitude and latitude values, while the z axis corresponds to depth. The color scale represents depth values. The points extracted from data are marked on the images, delineating the space actually covered by data meeting the selected criteria (in order to avoid confusion with extrapolated values).
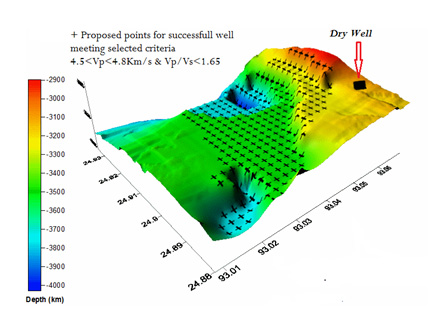
Points meeting the gas prone selection criteria [4.5
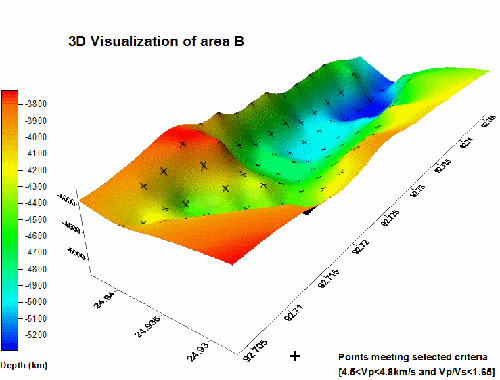
When evaluating the results presented in the above figure, it can easily be concluded that this part of the exploration block is characterized by values of Vp and Vp/Vs meeting the selected criteria at depths varying between 2.9 and 4km and could be promising in terms of hydrocarbon indications. The two unsuccessfully drilled wells were out of this area. Another two sub-regions of the exploration block have also been proposed as possible targets for successful drilling and are depicted below. As for the area B , the formation’s top surface extends a little deeper (at depths ranging from 3.8 to 5.3km) and must be thoroughly examined, in order to conclude whether the local conditions justify the appearance of a possible gas bearing formation at so shallow depths.
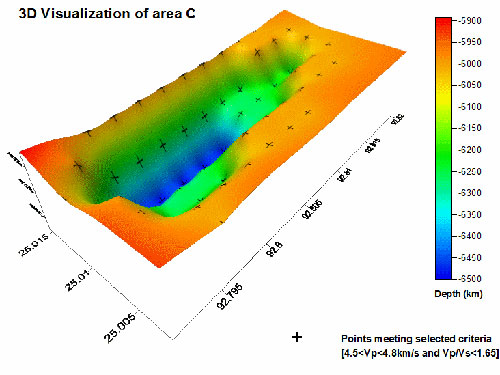
Finally, in the case of area C , the formation’s top surface is characterized by values of Vp and Vp/Vs meeting the selected criteria at very low depths (below 5.9km). Consequently, it seems highly unlikely that this particular area corresponds to some promising region, in terms of hydrocarbon exploration.
The above-mentioned analysis led to the conclusion that careful evaluation of the passive seismic tomography results, using all a priori available information, can result in the delineation of regions of interest for the upstream oil industry. This approach could offer an interesting option in case of exploration areas characterized by difficult topography or seismic penetration problems.
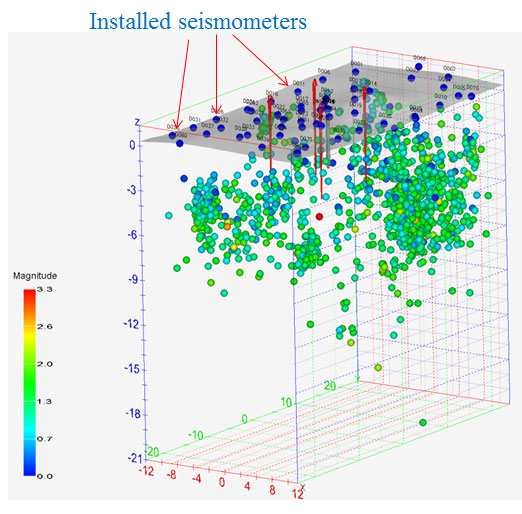
Case 9 Application of PST to delineate a gas producing reservoir and propose new well location
The client wanted to have an accurate picture of the 3D extend of the gas producing reservoir in order to increase the number of producing wells.
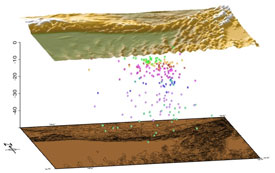
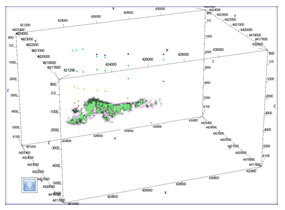
LandTech installed 95 passive seismic seismometers over the region of interested and recorded 987 events for a recording period of 8 months. The recorded seismicity and a vertical section depicting the recorded events with depth is presented in the following figure.
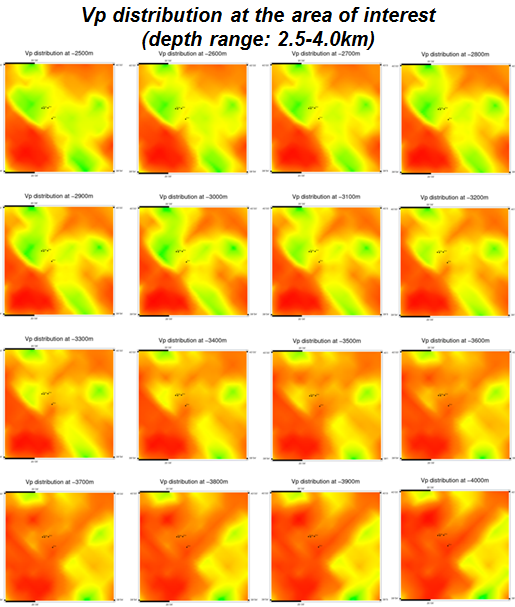
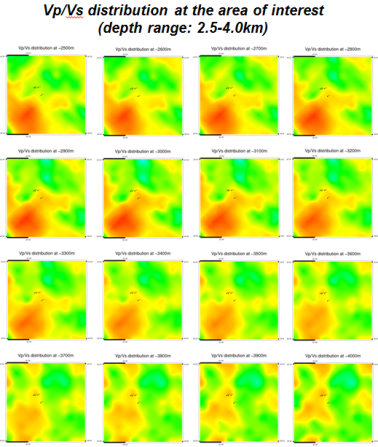
The figure bellow presents the obtained Vp/Vs and Vp plane-sections of an 8x8km2 area around the gas field, at depths varying between 2.5 and 4km (every 100m).
By isolating regions characterised by
- Vp values ranging between 5.2 and 5.3km/s.
- Vp/Vs ratio values ranging between 1.78 and 1.80.
Which are known that most probably correspond to the gas reservoir properties, the following targets have been proposed to the client.
The producing company drilled the first well (red arrow in the above figure) which was a producing one. More wells are also planned based on LandTech’s results.
Case 10 Using PST to map an evaporite cup of a gas reservoir
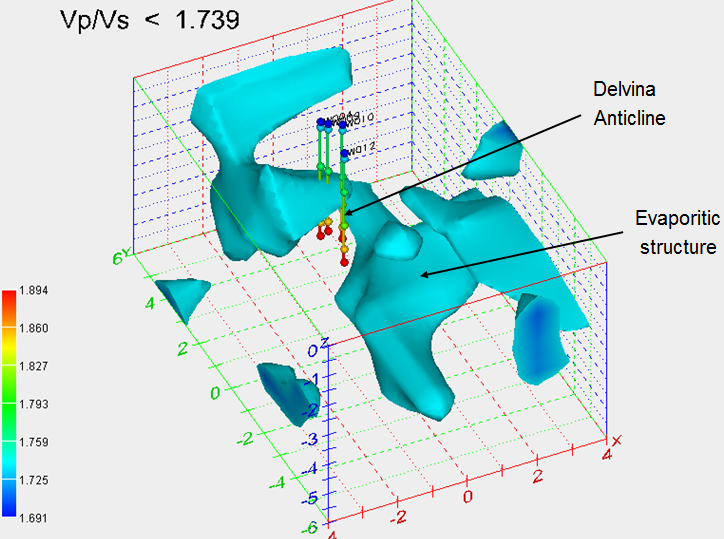
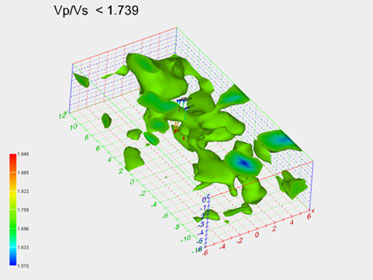
The client wanted to define the evaporite cap of a gas reservoir in order to decide the location of 3 planed wells after constructing 2 dry wells . A 2D seismic survey that was contacted in the area provided no results due to heavy seismic penetration problems caused by the heavily weathered surface limestone and an extensive layer of evapoorites. From sonic measurements within the existing wells and core measurements it was found that the evaporites were characterized by values of Vp/Vs less than 1,739.
LandTech installed a 64 stations passive network and operated it for a period of six months. Isolating the formations with Vp/Vs values less than 1.739 a general view of the evaporitic cap was obtained (see figure below).
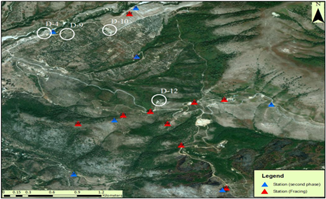
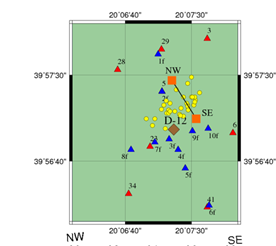
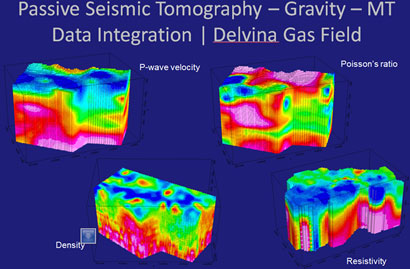
CASE 11 Surface monitoring of hydraulic fracking and delineation of fracture zones
LandTech’s LT-FS sensor is the only surface sensor in the market which can record microseismic events (even negative magnitudes!) from many Km down even microseisms generated during hydraulic fracking of a reservoir. This sensor has an external diameter of 50mm allowing it to be installed into small and shallow boreholes, hence reducing the cost of installation. At the end of December 2011, Stream Oil & Gas Ltd had planned to apply the technique of hydraulic acid fracturing in Well D-12 of the Delvina block, aiming to increase the rate at which natural gas is produced from this wellbore. In the frame of this, LandTech was asked to monitor and study the possible microseismic and seismic activity on this area, which is related to the hydraulic fracturing, by using a supplementary surface network of seismic stations. The scope was to drive a horizontal well towards regions crossing major fractures and faults in order to increase the production rate.
A microseismic network consisting of 16 LandTech’s LT-FS sensors was installed on the surface around the well (D12) which was used for the hydraulic fracturing experiment.
Surface passive network
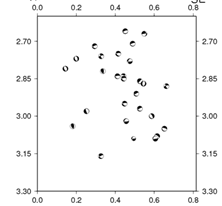
The network delineated very clearly the pattern of the induced microseismicity using only the surface sensors and without the need of an observation well. As it can be judged from the following figure all the events are concentrated within a zone at the fracking depth.
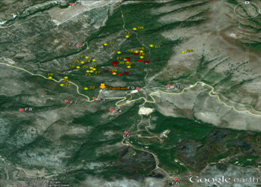
Epicenters of the recorded induced events
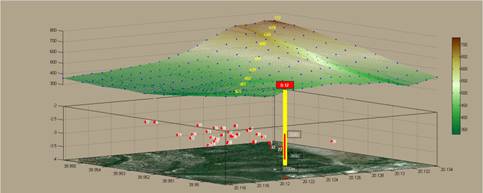
Recorded hypoocenters, red line indicates fluid injection level
In addition the location of the induced microseisms all the corresponding focal mechanisms for all the events were also determined depicting accurately the directions of the fracture zones as it can be seen in the following figures.
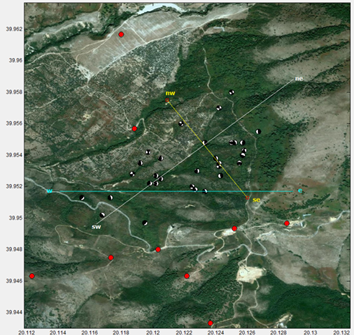
The possible faults/fractures as proposed by the focal mechanisms have been superimposed on the map (lines). Most of the faults are reverse and show a North-South and Northwest-Southeast trend being in good correlation with the known thrust faults in the area. There are also a couple of strike-slip (or oblique reverse) faults that trends from Northeast to Southwest and are located at the northern part of the area that is covered by seismic events, about 900m and 550 meters from Well D-12.
The recorded events related to hydraulic fracturing applied to Well D-12. W-E Cross-section with focal mechanisms and fault pattern is depicted.
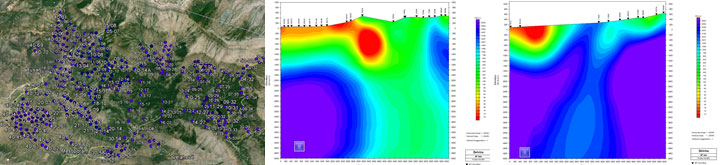
Case 12 How a PST survey delineated a gas and an oil reservoir
The client was operating a gas and oil producing block and wanted to delineate farther the distribution of the gas and oil reservoir in order to extend its drilling program. The conventional seismic provided no information and were rather useless due to a heavy limestone weathering zone extremely rough topography and severe seismic penetration problems due the existence of an evaporitic layer.
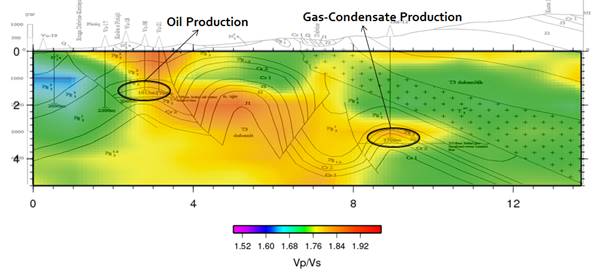
A high resolution passive seismic tomography using 90 LandTech’s passive seismometers was contacted over the area of interest. Two 3D velocity and Vp/Vs cubes were obtained bellow the entire block and revealed unknown structural details and even more delineated the hydrocarbon reservoir with surprising accuracy. Below we depict to Vp and Vp/Vs sections cut from the 3D volumes.
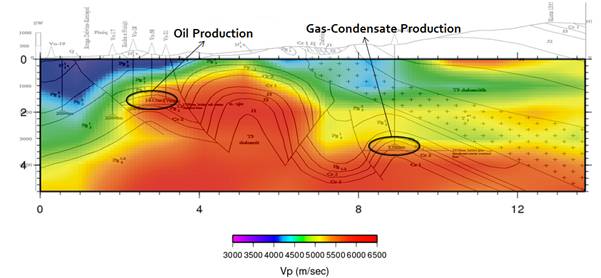
Although the Vp results show structural details which can justify the location of the reservoir if one looks at the Vp/Vs results can clearly see the extend of the gas reservoir. We remind again that conventional seismic were totally useless.
Case 13 Example of an Integrated PST, MT and Gravity investigation
The client wanted to delineate production zones within a gas reservoir in order to drill new wells. The project area was 400,000 Km2 . MT and Gravity measurements were made over 380 and 400 sites respectively. The PST network consisted of 80 stations operated for a period of 8 months.
By using as selection criteria the value ranges observed around a known productive horizon:
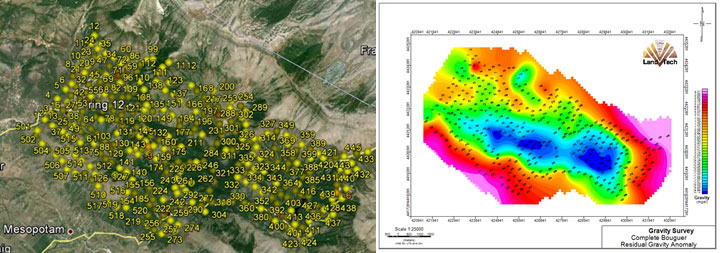
Vp : 5.1 to 5.3km/s || Vp/Vs : 1.78 to 1.80 || Density : 2.63 to 2.68g/cm3 || Log(rho) : 2.7 to 3.9 and Depths below 2km the following drilling sites were proposed
+=Proposed drilling sites
|
View of the expected reservoir
|
Case 14 Example of fluid identification
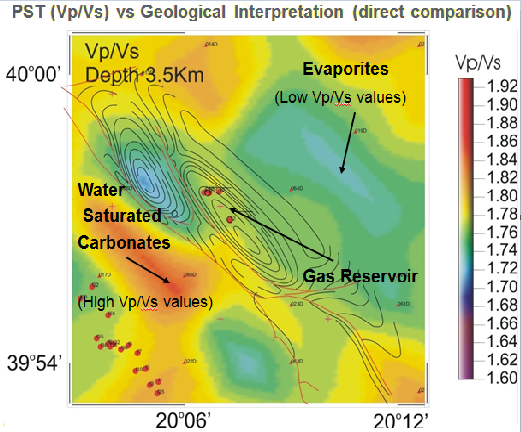
This example is from a geologically complex thrust belt area where we encounter carbonates, evaporates, water saturated carbonates and a gas reservoir. The client wanted to delineate better the gas reservoir.
The use of shear wave together with the compressional wave may be very useful for fluid dentification. From observation, it is found that light hydrocarbon saturation decreases the velocity of compressional wave and increases the velocity of shear wave through porous rocks (relative to formation water saturation). Either shear wave or compressional is conjugately affected by rock density and elasticity. There is a smooth decrease of density with the replacement of water by light hydrocarbon or gas. Elasticity, however, is different. The ease with which the solid material can deform into pore is scarcely affected by the presence of some water; all deformation is readily absorbed by gas in the reservoir. This is true whether the water saturation in the pore is 10, or 40, or 70%; the remaining gas absorbs deformation. Over this range of water saturation, therefore, the elasticity remains substantially constant, while the density decreases; it follows the shear velocity increases with the gas saturation increase. When the water saturation approaches 100%, the velocity must rise considerably; there is no gas left to absorb the deformation and the deformation is resisted appreciably by the water. All change between gas saturated velocities and water saturated velocities therefore occurs with the very first bubble of free gas within the pore.
The fact that compressional wave is affected by change in size and deformation, the replacement of water by gas will decrease density and also elasticity (change in size, bulk modulus k and deformation, shear modulus μ; only deformation will be absorbed by gas) in a conjugate effect; causing a decrease in compressional wave. When gas saturation reaches residual gas saturation and the water becomes the major fluid, there is no gas free to absorb deformation, shear wave will suddenly increase. On the other side, compressional wave velocity will not be much affected and it will keep the same increasing trend with the increase of water saturation.
Although the analysis of S-wave data can significantly reduce the uncertainty in interpreting seismic data, such data are also more difficult to collect. PST methodology can provide reliable VP and VS data bellow the entire block and at a function of the cost of conventional methods which provide data locally (e.g. VSP).