Benefits
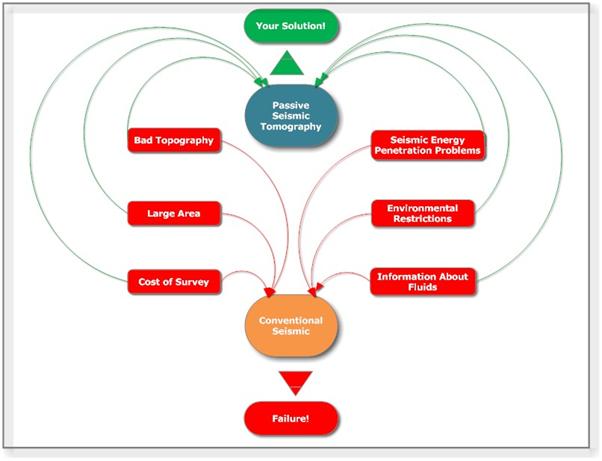
The benefits of Passive Seismic Tomography are substantial:
Operational
- It can be applied to the most mountainous and difficult terrains (rain forests, swamps etc.) since we only have to install single seismographs at points spaced a few Km apart and there is no need of dense geophone layouts.
- There is no need of explosives, vibroseis etc. since we use the natural microseismicity as seismic sources.
- No day-to-day operations etc.
- No permits required.
Technical
- Provides 3D geological detail beneath the entire exploration block no matter how big and accessible is (even many thousands Km2).
- Ideal for regions with seismic penetration problems such as heavily weathered surface layers, basalt barriers, etc. (in Passive Seismic Tomography microearthquakes play the role of seismic sources within or below the target, so we have only 1-way ray paths, crossing the medium of interest, from the source to the sensor at the surface).
- In many cases (difficult geologies, high topographic reliefs, strongly attenuating media) provide data better than conventional seismic.
- Provides not only 3D Vp but also and Vs velocity variations beneath the entire exploration block.
- Provides 3D distribution of Poisson’s ratio which depends upon the kind of fluids in the pore space (water, gas, oil).
- We can easily obtain 2D horizontal and/or vertical sections whenever we want throughout the exploration block.
- We can get an animated 3D animated video of Vp, Vs and Poisson’s ratio parameters below the entire exploration block.
- We can use the 3D velocity data to reprocess conventional seismic data (post stack depth migration) and increase their resolution.
- We can get a 3D variation of the seismic attenuation (or rock quality factor) below the entire exploration block. A parameter dependent on fracturing, and the kind of fluids in the pore space.
Economic
- We can explore large areas (many thousands of Km2) at a fraction of the cost of a conventional 2D seismic.
- No need of explosives vibroseis or expensive seismic gear (e.g. cables, telemetry nodes, geophones).
- It requires only a fraction of the personnel (seismic crew) required for a conventional seismic survey.
Environmental
- 100% safe to the environment.
- No explosives, road blocking for vibroseis etc.
- Uses natural seismicity as a source.
- Ideal for environmentally sensitive regions (rainforests, national parks etc. tropical forests, swamps etc.).
- No special permits required even for environmentally sensitive areas.
Other
- Can be used in frontier geopolitical exploration areas to build a pre-project plan at minimum cost.
- Used to investigate very large areas to define places where to apply conventional seismic (better layout of seismic lines), so reduce the exploration cost.
- Provide confidence on exploration activities not only by defining an accurate geological setting but also minimizing the investment risk.
Some Examples
Accuracy
The following example shows how a PST survey using natural microearthquake seismicity can be compared to conventional seismic as far as seismic ray coverage and accuracy is concerned. In the figure below we present a simple case showing the ray paths from only 6 microearthquakes to only 11 surface stations. Imagine the resolution obtained if we use the whole of the recorded microearthquakes (usually 600-1000) and an array of many surface stations (70-100 in average). In this case many thousands of seismic rays will cross very densely the space below the exploration block.

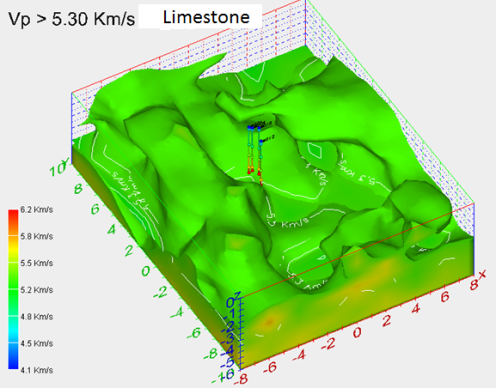
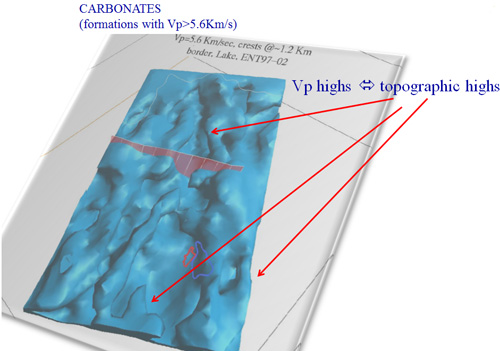
3D mapping of geological formations even below blocks with high topographic relief
The following figure shows the mapping of an evaporitic layer below a mountainous limestone block. This result was obtained from a 3D PST data volume by isolating velocities corresponding to the evaporites.
3D Velocity structure below the entire exploration block
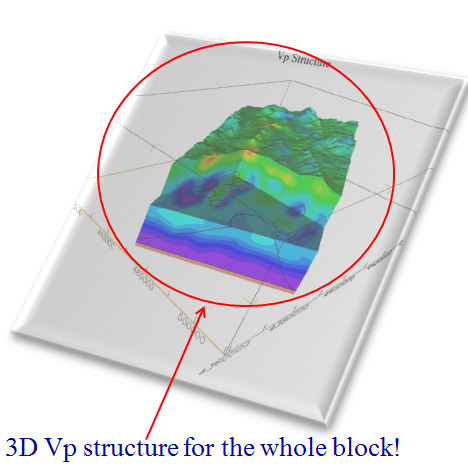
Click here to watch a 3D Vp video below an exploration block obtained from a Passive Seismic Tomography survey.
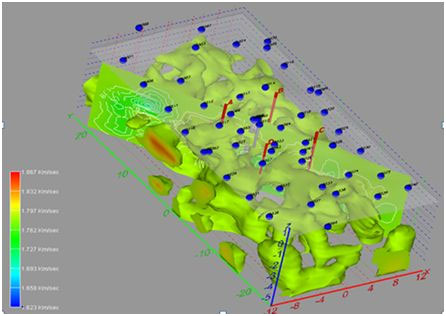
3D Vp/Vs structure below the entire exploration block
In the following example we show a 3D view of all Vp/Vs values >1.785 between an exploration block delineating possible hydrocarbon traps.
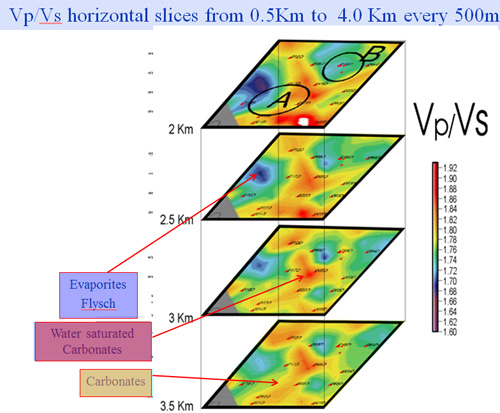
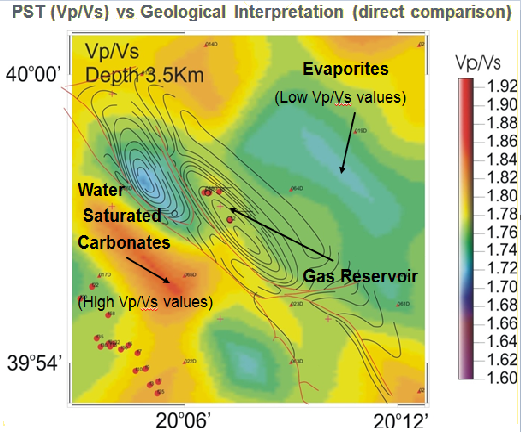
The figure below shows how Vp/Vs values can differentiate water saturated carbonates from carbonates and flysch.
3D basement mapping below a block
Pinpoint drilling sites using the PST method
Although a Passive Seismic Tomography (PST) survey provides mainly, structural and lithological information below the entire block of interest and cannot be considered as a direct hydrocarbon indicator in certain cases we can provide maps which depict sub regions within the investigated block possessing high probability for a successful well. This is due to the fact that one of the products of PST is and the Poisson's ratio which strongly depends on the fluid content within the pore space. By imposing certain limits for the expected depths, Seismic Velocities, Poisson’s ratios and Qp attenuation parameters we can cut off the 3D data volumes the regions possessing the highest probability for drilling a producing well.
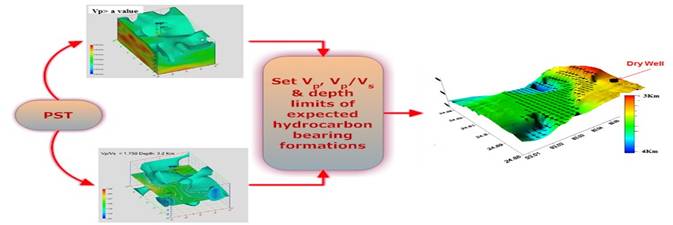
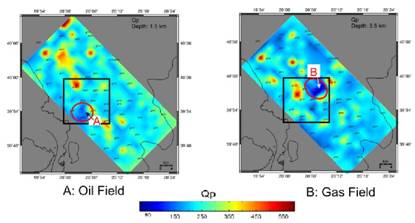
Since the PST method provides and 3D volumes of the seismic attenuation properties of the formations (e.g. Qp parameter), below the entire exploration block, this parameter can indicate fracture zones, high pore spaces and in many times differentiate oil and gas within the pore space.
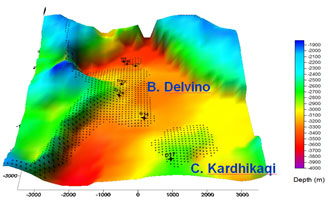
Another example of identification of candidate drilling sites in a hydrocarbon oil field in Albania is presented in the figure below. Crosses are producing wells, dots are proposed new drilling sites.
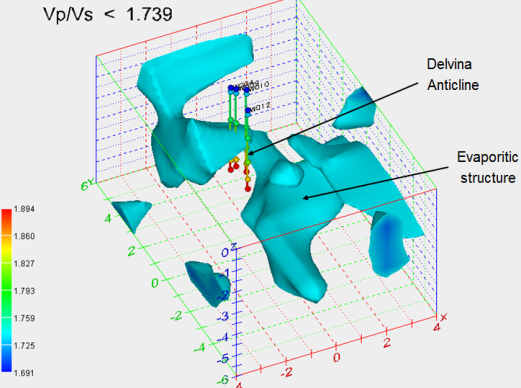
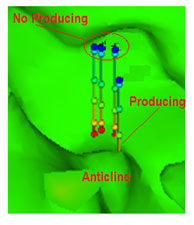
Below we depict another example where PST results were used to explain why the 3 wells were unsuccessful and the one set up on the top of the anticline structure was successful.
Fluid identification
The use of shear wave together with the compressional wave may be very useful for fluid dentification. From observation, it is found that light hydrocarbon saturation decreases the velocity of compressional wave and increases the velocity of shear wave through porous rocks (relative to formation water saturation). Either shear wave or compressional is conjugately affected by rock density and elasticity. There is a smooth decrease of density with the replacement of water by light hydrocarbon or gas. Elasticity, however, is different. The ease with which the solid material can deform into pore is scarcely affected by the presence of some water; all deformation is readily absorbed by gas in the reservoir. This is true whether the water saturation in the pore is 10, or 40, or 70%; the remaining gas absorbs deformation. Over this range of water saturation, therefore, the elasticity remains substantially constant, while the density decreases; it follows the shear velocity increases with the gas saturation increase. When the water saturation approaches 100%, the velocity must rise considerably; there is no gas left to absorb the deformation and the deformation is resisted appreciably by the water. All change between gas saturated velocities and water saturated velocities therefore occurs with the very first bubble of free gas within the pore.
The fact that compressional wave is affected by change in size and deformation, the replacement of water by gas will decrease density and also elasticity (change in size, bulk modulus k and deformation, shear modulus μ; only deformation will be absorbed by gas) in a conjugate effect; causing a decrease in compressional wave. When gas saturation reaches residual gas saturation and the water becomes the major fluid, there is no gas free to absorb deformation, shear wave will suddenly increase. On the other side, compressional wave velocity will not be much affected and it will keep the same increasing trend with the increase of water saturation.
Although the analysis of S-wave data can significantly reduce the uncertainty in interpreting seismic data, such data are also more difficult to collect. PST methodology can provide reliable VP and VS data bellow the entire block and at a function of the cost of conventional methods which provide data locally (e.g. VSP).
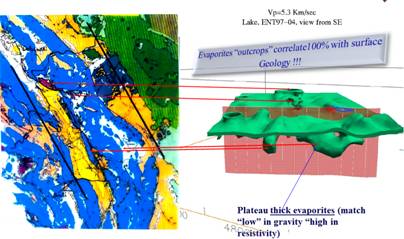
The figures below show how a PST survey revealed the cup (evaporate) and the bottom (Limestone) of a gas reservoir in Albania.